

Landscape visualisation and modelling
- Title
- Landscape visualisation and modelling
- Creator(s)
- Margherita AzzariSee all items with this value
- Paolo LiveraniSee all items with this value
- Date
- 2024
- Is Part Of
-
 Archeologia e Calcolatori
- Volume
- 35
- Issue
- 2
- Pages
- 277-284
- Language
- eng
- Rights
- CC BY-NC-ND 4.0
- Abstract
- The contribution draws on the experience gained within the Rome Transformed project on the Eastern Caelian hill, reserving a with more general attention to problems of method. The spatial dimensions of the project pose problems including – but at the same time going beyond – those normally addressed for the visualization of individual surveyed structures. Two points seem crucial: 1) the transparency of metadata and paradata; 2) the tension between too much or too little prescriptive models or ontologies. Visualizing a territory poses peculiar problems; we have several examples in the past, but normally the reconstruction of ancient orography on which to place surveyed structures is not explicitly thematized. The territory imposes a leap in scale in the size and management of the data; forms the palimpsest on which to arrange the views of the individual sectors or structures into which it is divided; defines the ‘conditions of existence’ of topographical and monumental articulation; must consider the effects that older phases impose on later ones. Visualization of a territory is not only a way to present to the scientific community and the wider public in a concise manner the results achieved. Such an approach poses the need to work in an environment in which it is possible to progressively incorporate evidence of a very heterogeneous nature such as archival data, geognostic surveys of different types, surveys using traditional techniques or 3D scanning, and core drilling. The organisation of such heterogeneous data within a single software becomes essential for their subsequent processing. It was therefore necessary to design an application able to manage in a single three-dimensional environment the data produced while maintaining the associated information (metadata and paradigms) in order to allow them to be compared and at the same time guaranteeing full interoperability with the GIS environments in which the modelling activity is carried out.
- Zotero References Collection
- https://www.zotero.org/groups/5293298/bidiar/collections/IV7EY2KE
Linked resources
Export
- Media
-
 Project visualisation (‘provocation’) showing the Constantinian Basilica’s spatial relationship to the Castra Nova that previously occupied the same site (Iwan Peverett and Ian Haynes, incorporating a visualisation of the Constantinian Basilica developed by Lex Bosman, Paolo Liverani, Iwan Peverett & Ian Haynes, and work on the baths/Baptistery by Thea Ravasi)
 -
 Paolo Anesi, View of the Lateran from East (oil on canvas, 18th cent.), Diocesan Museum of Milan
 -
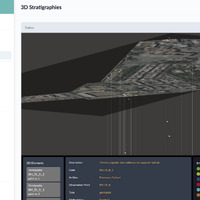 The RT3D environment
 -
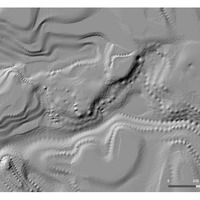 Digital Terrain Model of the study area during the Severan period. Reconstructive hypothesis based on data from literary and archival sources, historical cartographies, structural analysis and non-invasive surveys. The image shows the surface generated using the Inverse Distance Weighted (IDW) interpolation method, which allowed the z-values of the fiducial points to be preserved, before the final smoothing operation.
 -
 A 3D rendering of the Lateran area during the Severan period. The surface model was created using the IDW method in ArcGIS pro, then imported into ArcGIS City Engine and into Twinmotion for rendering. The building in the foreground was created using 3D Studio Max (Iwan Peverett & Thea Ravasi) and imported into Twinmotion
Position: 4618 (15 views)